A Virtuous Cycle
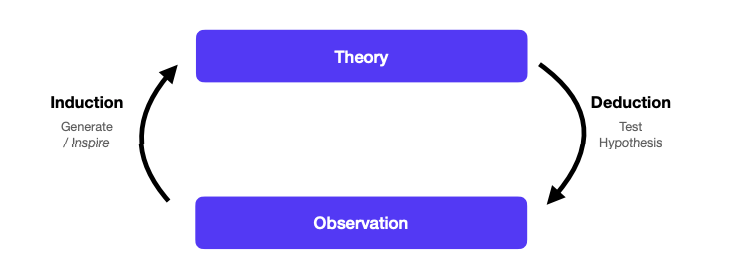
Theories attempt to explain something about a natural phenomena, observations validate existing theories, or inspire new ones.

Induction - Theories arise from data
Deduction - Conduct observations to test theory
Replicable
Others should be able to do the same study and get the same results
- Supporting observations
- Currently a replication crisis in Science (as low as 23% in Psychology)
If not replicable, not necessarily fraudulent
- Selection bias, confirmation bias, pressure to publish
Falsifiable
Claims should be able to be disproven; the falsifiability of the claim is not dependent on whether it is false or not, but rather if there it some conceivable evidence that could exist that would disprove it.
Parsimony
Scientists should accept the simplest explanation (fewest assumptions).
Simpler theories tend to be more testable. Design your experiments to test parsimonious explanations. Tend to generalise better, when evidence exists for competing theories, you have to accept the strongest evidence.
Can technology improve social interactions when shy people meet others for the first time?
We need: hypothesis and experiment plan.
Constructs and Variables
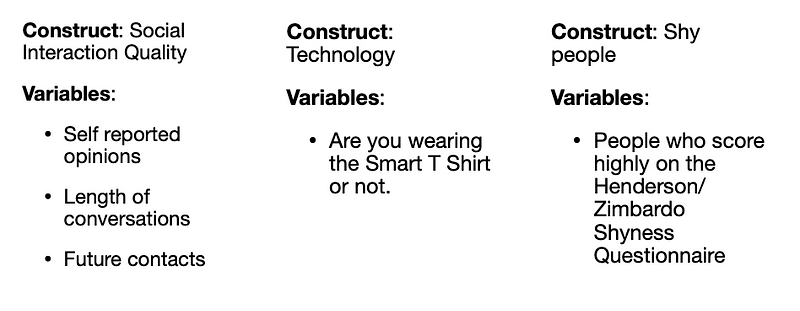
Construct is an abstract concept explaining a phenomenon, variable is a measureable representation of a construct:
- Happiness v.s. Smile Frequency
- Intelligence v.s. IQ
- FYI, there are at least 16 different scores questionnaires for stress
Can technology improve social interactions when shy people meet others for the first time?

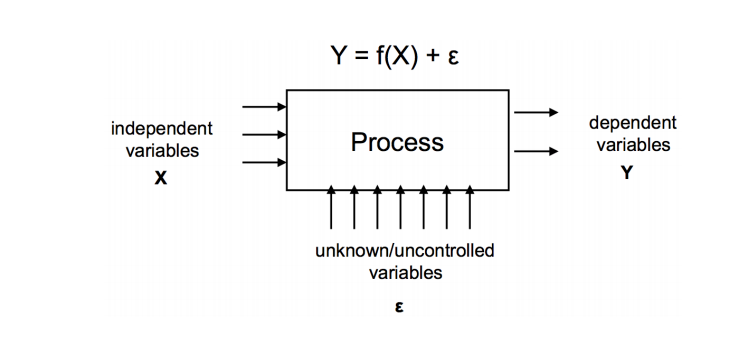
Independent:
- Explain other variables (this is what we vary)
- Inclusion of technology
- Type of technology: different settings on your T Shirt
- Social context: speed dating, industry networking
Dependent:
- Explained by other variables (this is what we measure)
- Length of conversations
- Number of meetings in subsequent 3 months

Confounding Variables
Things that could also account for apparent relationships that are not the variables being compared in the experiment.
Time of year/day, weather, location, previous experiences of participants.
- Is shyness effected by coountry?
- Was it raining on one of the days?
- Removing clothing choice from participants effected their confidence
- Age
- Is it a first time meeting?
- Are there genuinely just compatible people?
Within Subjects v.s. Between Subjects
Between subjects:
- Each participant only has one condition
- No learing effects
Within subjects:
- Each participant does all coditions
- Removes user variation concerns
How do we recruit? Is this a representative population? Should aim to reduce variation between gourds, randomly assign groups (avoiding selection effects).
Participants should not know which group they are in, more relevant in medical trials.
Experimenters should not know which group they are in (Experimenter Bias), e.g. if we were using an external rating of quality of interactions.
We advertise widely for shy people to take part in a study. They are validated as shy by taking the online survey. We randomly assign groups (who has smart T-shirts), and hold separate sessions with a between subjects design.
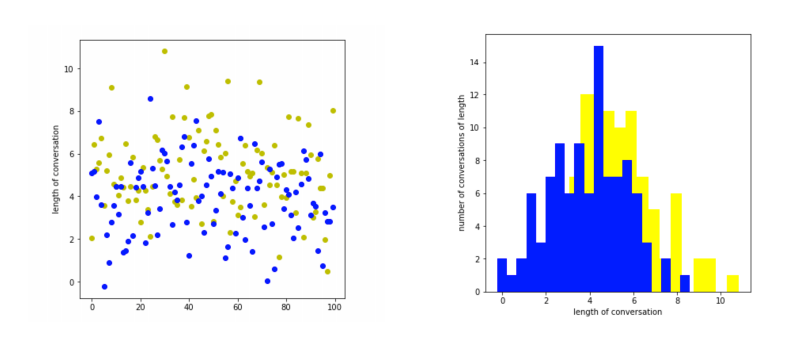
Each participant meets 5 other participants and we time the length of conversation.
In a between subjects design, we are comparing means of two groups. If there is a difference, can we say our measurements are not coincidence or caused by noise?

Statistical Test:
- Our hypothesis says mean(Shirts) > mean(NoShirts)
- Null hypothesis says mean(Shirts) = mean(NoShirts) (no effect)
- We calculate the likelihood of the null hypothesis with a p value
- p < 0.05 means there is a 95& chance our difference is real
- All tests make assumptions about the data that must hold true!
- Influenced by size of effect and number of measurements
T - Test:
- Measures between subjects with two groups
- Tells us whether one mean is higher than the other
- p value indicates how confident we can be in this result
- Assumes equal variance, normal distribution and independence
Paired T - Test:
- Measures within subjects with two groups
- All participants wear t-shirts for conversations, and then all participants do not wear t-shirts for conversations
- Tells us about the differences in each participants measures
- p value indicates how confident we can be in this result
- Assumes normal distribution and lack of outliers
One way ANOVA:
- Measures between subjects with more than two groups
- There are 3 different designs of t-shirts, each group only tries one
- Tells us the differences between multiple means
- p value indicates how confident we can be in this result
- Assumes equal variance, normal distribution and independence
Feminist theories of science seek to explain how the exclusion of certain groups from science - women and other underrepresented groups - has affected the practices and outcomes of science.
Female, Black, Dsiabled and LGBTQ+ communities tend to be underrepresented in institutions that conduct scientific research.
The leads to bias in what research gets conducted, the experiences that get foregrounded.
Scientific and statistical methods have been used to justify racist policies of colonialism, slavery and eugenics.
Scientific and statistical methods have often excluded female experiences: lack of research in male contraception, drugs aonly tested on men.
Further Reading:
• Caroline Criado Perez - Invisible Women
• Angela Saini - Inferior: How Science Got Women Wrong
About this Post
This post is written by Siqi Shu, licensed under CC BY-NC 4.0.