We have often been building model that predict new labels, given a new input, but, what if we do not have a labelled dataset to make the model?
Clustering
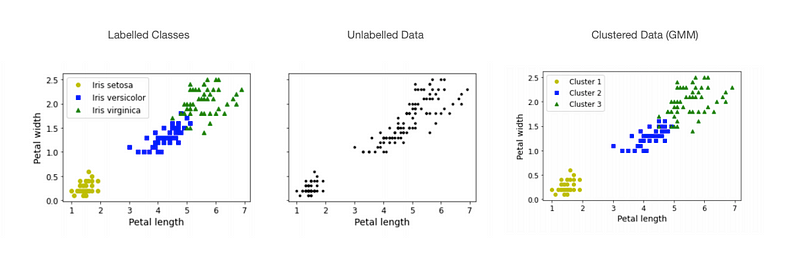
Unsupervised learning is used to solve a number of problems where data is not labelled. Clustering is a method to group similar examples in clusters.
- Customer segmentation
- Recommendation systems
- Search engines
Anomaly Detection
Unsupervised learning is used to solve a number of problems where data is not labelled. Anomaly detection can model what is normal, then use this to spot things that deviate from this. A low affinity for any cluster may can flag something or someone as an anomaly.
Use Cases
Customer segmentation: group customers together that may receive certain recommendations, promotions, options.
Data analysis: is you are looking at a big dataset, you can cluster first then analyse each cluster in more detail.
Dimensionality reducation: we can use the measure of how well a model fits into each cluster as a feature representation. This turns out to be actually quite good for them fitting other models. This is similar to when we used the topic vector as a input for text classifiers.
Semi supervised learning: if you only have the resources to label a few examples:
- Cluster
- Label the examples near the centre of the clusters
- Propagate to other examples in the cluster
- Train model with more labelled examples = More accurate model!
Recommender systems: cluster everything in your database then return other examples from that cluster as similar to your users.
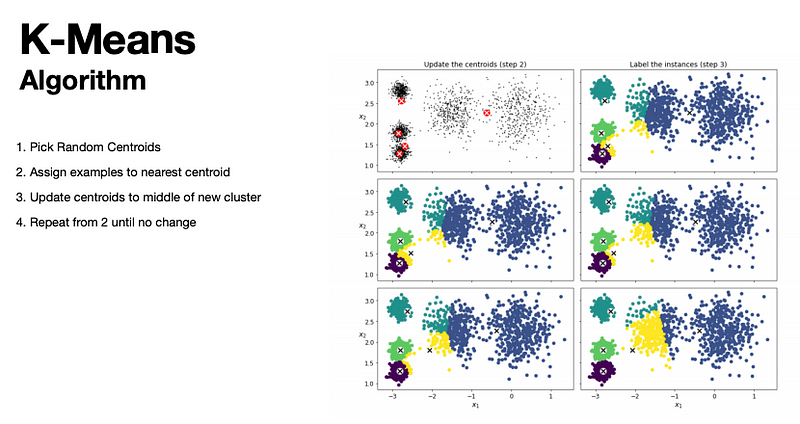
K-Means
For K-Means, you generate k centre points (centroids) (one for each k clusters).
In hard clustering, each example belongs to the cluster whose centre it is closest to.
In soft clustering, we represent the example as the distances to each centre.

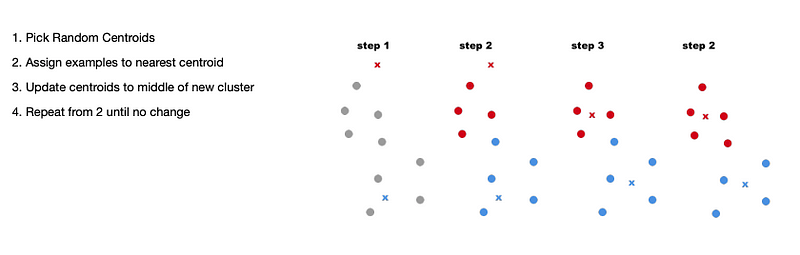
K-Means Algorithm:
- Pick Random Centroids
- Assign examples to nearest centroid
- Update centroids to middle of new cluster
- Repeat from 2 until no change
Initialising Centres
K Means will always converge (e.g. reach a stopping point), but it does not mean this is the best solution.
Whether it is or not depends on how the centroids were initialized.
Sometimes we can run multiple times with different centroids and pick the best.
Whats the best values for k?
We can compare inertia scores for each value, which tells us the: Mean suqared distance between each example and its nearest centroid. The closer examples are to the centroids, the better.
The more clusters there are, the smaller the distances will be! We can aim to pick the k value that gives us the biggest improvement.

Image Segmentation
We can use clustering to group together pixels that have similar colours; in some situations, this can group together things which are of the same type or object (e.g. forest or lake from satellite imagery).
Each pixel in a colour image is represented 3 colour values, so we can think of this as a clustering in RGB space.
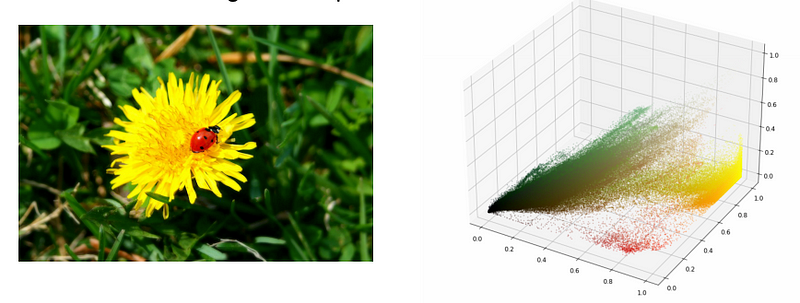
Once we have made the clusters, we areplace the original pixel value with the mean value for that cluster.
This makes a segmented image with much less colour variation.
See the red disappear as we reduce the number of clusters.
Semi Supervised Learning
For classification tasks, when we only have a few labels, or limited resources for manual labelling, or we need quick training on few examples. We can use clustering to help us!
For choosing what to sample:
- First we cluster the dataset
- We then pick the most representative examples from each dataset
- Label only these
- Train Classifer => Often improved accuracy (vs randomly chossing a subset to label)
Label propagation: if we want we can then copy the labels to everything else in the cluster and this again can increase accuracy.
Feature Scaling
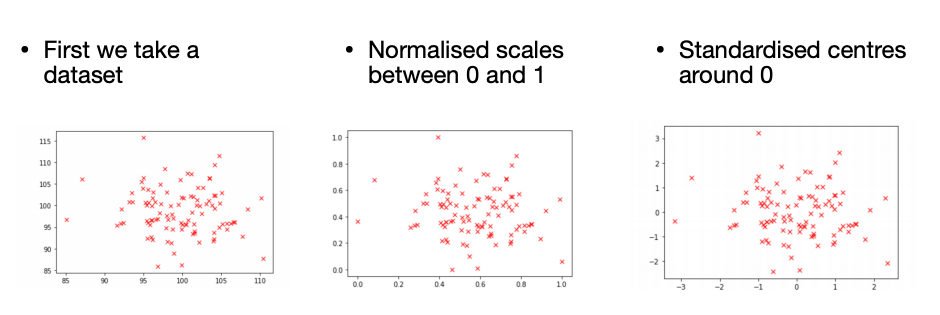
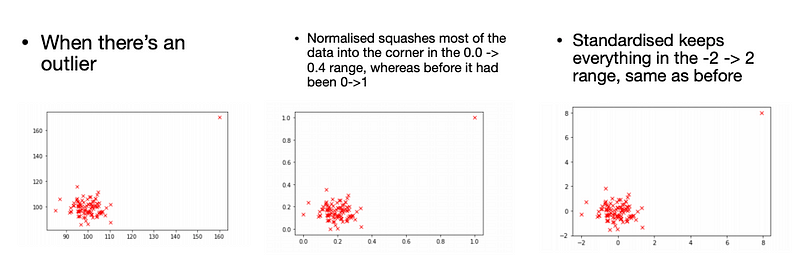
We have seen min-max scaling (or normalisation) when looking at neural networks. This is where we scale all values between 0 and 1. This can be effected by outliers.
Scaling aims to maintain the relative relationships between examples but makes features more comparable as they are all on similar scalers, and is necessary for some machine learning techniques to work.
Necessary for K Means (and PCA)
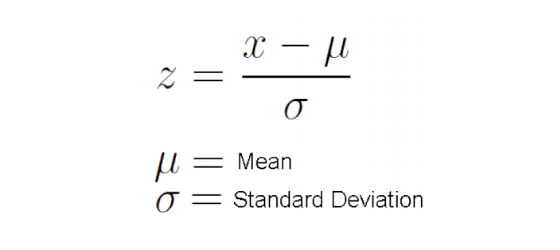
In standardisation, we scale each column so its mean is 0 and its variance is 1.
We do this by subtracting the mean and dividing by the standard deviation.
K-Means is scalable and fast, but doesn’t work as well when clusters are differently sized, and non spherical shapes. (e.g. don’t easily get drawn to a centre)
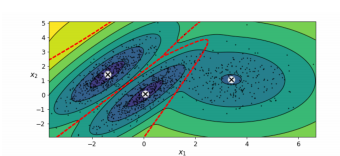
Gaussian Mixture Models
Gaussian distribution is another name for a normal distribution, we imagine the dataset is made up of a series of normal distributions, each defined by a mean and a standard deviation.
This algorithm finds the best values for these parameters.
Principle Component Analysis
Takes your features and reduces them to a smaller number.
Useful for visualizing (reducing dimensions to 2!)
Can be useful to do before modeling.
Makes training and running quicker.
Possibly reduces redundant features and a more efficient representation is easier to model or cluster.
About this Post
This post is written by Siqi Shu, licensed under CC BY-NC 4.0.