Probability
Basic probability underpins a lot of what we say as Data Scientists. Given some data we have, what can we say about the probability of things happening in the future? How certain can you be about something? That an event will happen? About a choice you are recommending? About a prediction you have made? How are probabilities effected by observations(e.g. more data)? How can we use these observations and probabilities to make predictions about new data?
Event
We commonly want to analyse incertain phenomena, such as the result of rolling a die, tomorrow’s weather, the winner of Drag Race 2021. To this end we model the phenomenon of interest as an experiment with several (possibly infinite) mutually exclusive outcomes.
One possible outcome is called an event, e.g. Tomorrow will be sunny, I will win Drag Race.
P(E) is the probability of an event happening, P(Sunny)=0.5, P(DR=I)=0.0001
P(E) is alwats between 0 and 1, P(not E)=1 - P(E)
Dependence and Independence
Events can considered dependent if knowing about the outcome of one effects the probability of another happening.
The probability of me eating lunch on time(P(L)), is effected by the number of meetings I’ve had in the morning(P(M)). These are dependent events.
In coin toss world, the probability of tossing a coin twice and getting two heads is effected by the result of the first toss. These are dependent events.
Otherwise, they are independent. The probability that I win Winner of the Year 2021(P(W)), is not efeected by knowing the outcome of sports match Sheffield Utyd .vs Wolves next Sunday, these are independent events.
In coin toss world, the probability of tossing a coin twice and getting a head on the second toss is not effected by the result of the first toss. These are independent events.
Calculating the Probability of Independent Event
P(A,B)=P(A)*P(B)
The probability of independent events A and B happening is the probability of a multiplied by the probability of B. Known as the Product Rule. If probability of getting a either result in a coin toss is 0.5, then the probabilty of getting two heads is 0.25.
Conditional Events
Conditional probabilities are an essential part of statistics because they allow us to demonstrate how information changes out initial assumptions.
Written as P(A|B), the probability of A, given B.
Probability of seeing the moon, given it is past 6pm. Probability of passing this class, given you have attended all the lectures.
Important to consider the difference between the two:
P(A,B) => The probability that two events will occur
P(A|B) => The probability that one event will occur, given that another has occurred
P(A,B) = P(A|B)P(B)
The probability of dependent events A and B is equal to the probability of A given B, multiplied by the probability of B.
Bayes Theorem
With Bayes’ theorem, we can reverse conditional probabilites - so when we know the probability P(B|A), we can work out P(A|B).
For example, I might want to know what the probability there is a staff party happening, given there are balloons in the cafeteria. I have recorded every time they have had balloons in the cafeteria, and how often this was party related; there were 300 balloon sightings over 2600 work days, and 250 parties, 200 with balloons.
P(A|B)=P(B|A)P(A)/P(B)
P(outcome|data)=P(data|outcome)P(outcome)/P(data)
P(party|balloons)=P(balloons|party)P(party)/P(balloons)
P(outcome|data) & P(A|B) & P(party|balloons) is called the posterior. This is what we are trying to estimate and is the probability of a party given we’ve seen balloons.
P(data|outcome) & P(B|A) & P(balloons|party) is called the likelihood. This is the probability of the new data, given our initial hypothesis. This is the probability of seeing balloons, given a party is happening.
P(A) & P(outcome) & P(party) is called the prior. This is the probability of our hypothesis without any additional prior information. This is the probability of there being a party, not considering any observations.
P(B) & P(data) & P(balloons) is called the marginal likelihood. This is the total probability of observing the evidence.
So, the final result is P(party|balloons) = 2/3
Calculating the Likelihood
How do we get rom our dataset to calculating the likelihood of some data, given a known outcome?
e.g. 200 days with parties and balloons, 250 days with parties: 200/250.
If we wanted to know the probability of a party given 4 balloons, we can see that 47 parties had 4 balloons, so P(4 balloons|party)=47/250.

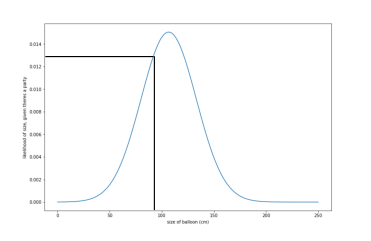
If its continuous data (e.g. measurement, time, temperature…), it’s a little trickier. Consider the probability of a party, given the size of the balloons(e.g. 90cm), as opposed to just their presence.
- P(party|90cmballoons)=P(90cmballoons|party)P(party)/P(90cmballoons)
As the size is continuous, we can not just look up the value in histogram to find its likelihood; we can keep making the bins size smaller, until eventually, we get a smooth line, or continuous function.
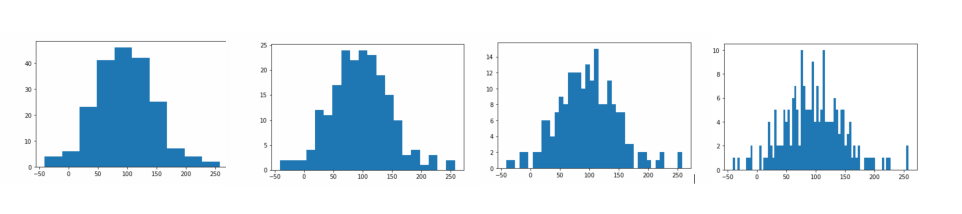
As the size is continuous, we can keep making the bin size smaller, until eventually, we get a smooth line, or continuous function.
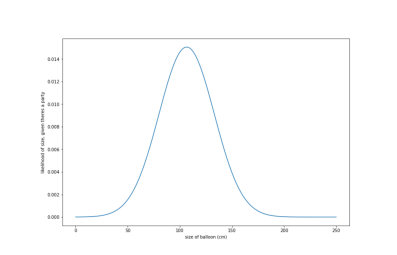
And this known as a probability density function. We can use this to look up the probability of a certain piece of data, given a class; e.g. What is the probability of having balloons that are 90cm diameter, given there’s a party?
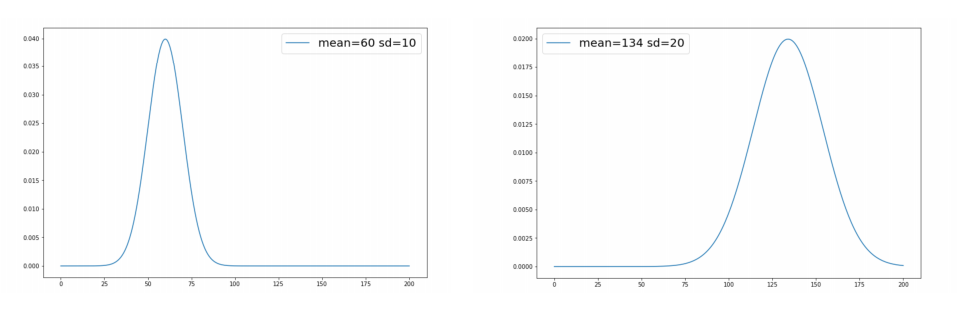
Normal Distribution
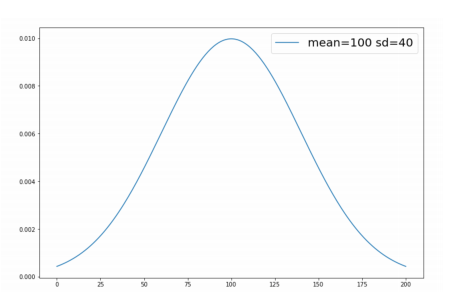
How can we get this function, given our data? Luckily, if we know the mean and the standard deviation, we are able to fit a normal distribution. Is is a good shape for most naturally occuring data. The normal distribution is a bell shape, cented around the mean; the standard deviation of the data determines the spread, area under the curve is 1.

Naive Bayes
We can use this approach, and Bayes Theorem, to address classification problems. Consider a typical classification dataset:
For each example, we have a number of observations (the inputs) and an outcome (the class label); this means for a new example, we can take each observation and work out the probability of it being part of each class, given a value of that new observation.
- P(class|data)=P(data|class)P(class)/P(data)
If we have multiple observations about each example, we simply get a probability for each one; and this is where the naive comes in, because we assume each observation is an independent event and just use the Product Rule and multiply all the probabilities together.
- P(A,B)=P(A)P(B)
However, in reality, each observation may, or may, actually be independent, however, the maths still works quite well often and we have a multi-input, multi-class, probabilistic classifier!
About this Post
This post is written by Siqi Shu, licensed under CC BY-NC 4.0.